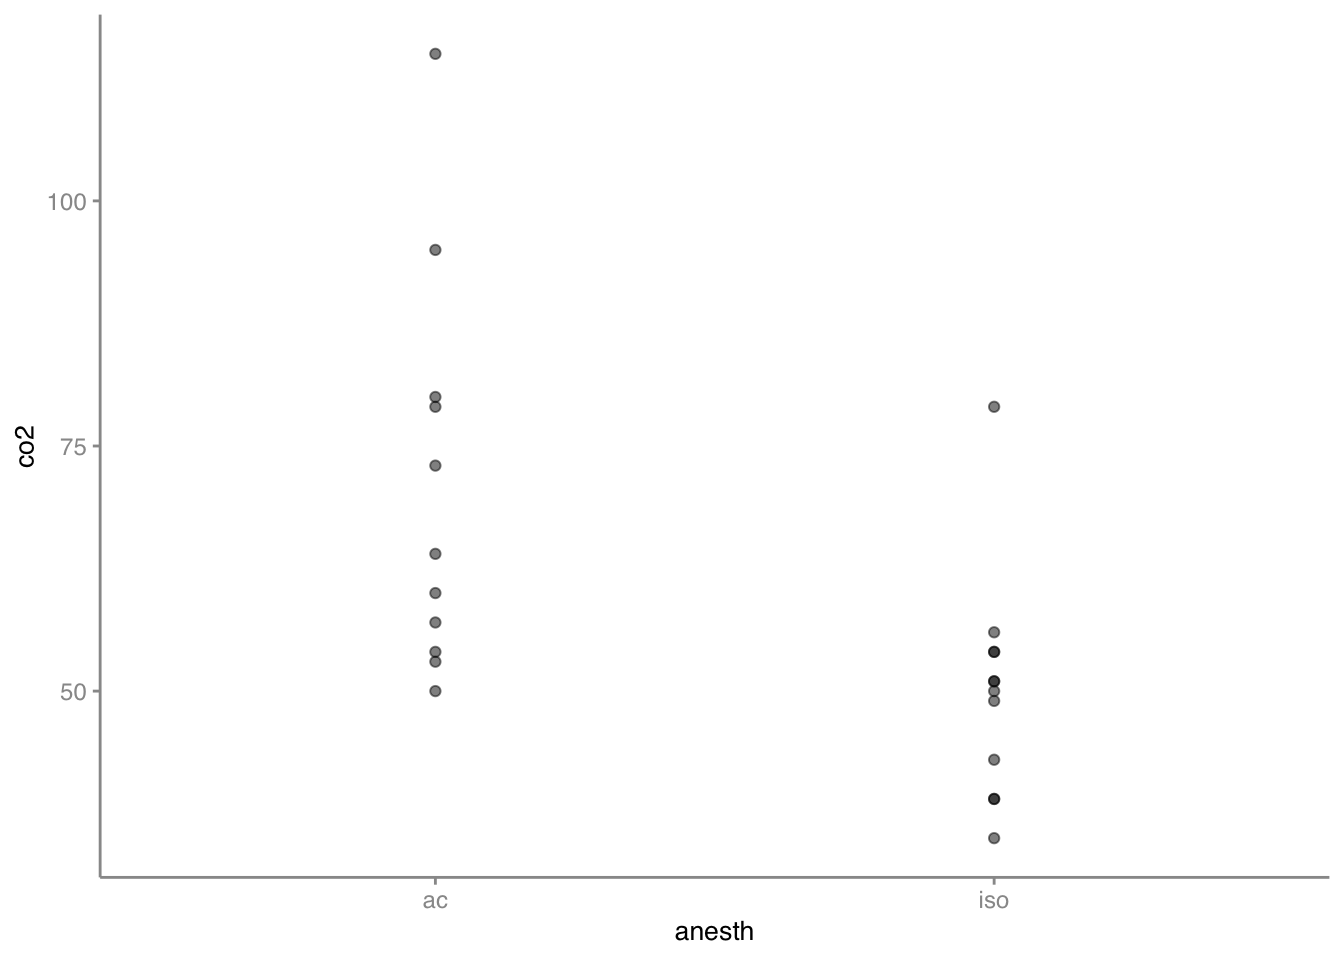
Low et al (2016) examined the effects of two different anesthetics on aspects of the physiology of the mouse. Twelve mice were anesthetized with isoflurane and eleven mice were anesthetized with alpha chloralose and blood CO2 levels were recorded after 120 minutes. The H0 was that there is no difference between the anesthetics in the mean blood CO2 level. This is an independent comparison because individual mice were only given one of the two anesthetics.
Preliminaries
First, load the required packages (tidyverse, RMisc, MKinfer, car, emmeans)
Import low data file
low <-read.csv("data/lowco2.csv")low
   anesth co2
1     iso  43
2     iso  35
3     iso  50
4     iso  39
5     iso  56
6     iso  54
7     iso  39
8     iso  51
9     iso  49
10    iso  54
11    iso  51
12    iso  79
13     ac  60
14     ac  53
15     ac  54
16     ac  73
17     ac  64
18     ac  95
19     ac  57
20     ac  80
21     ac 115
22     ac  79
23     ac  50
  anesth  N      co2       sd       se        ci
1     ac 11 70.90909 20.20126 6.090909 13.571391
2    iso 12 50.00000 11.39378 3.289100  7.239261
low %>% dplyr::count(anesth)
  anesth  n
1     ac 11
2    iso 12
low %>%group_by(anesth) %>% dplyr::summarise(n =n(), mean =mean(co2),median =median(co2),sd =sd(co2), variance =var(co2), se = sd /sqrt(n), CI_upper = mean + se *qt(p =0.975, df = n-1), CI_lower = mean + se *qt(p =0.025, df = n-1), CI = se *qt(p =0.975, df = n-1), upper = mean + CI, lower = mean - CI )
# A tibble: 2 × 12
  anesth     n  mean median    sd variance    se CI_upper CI_lower    CI upper
  <chr>  <int> <dbl>  <dbl> <dbl>    <dbl> <dbl>    <dbl>    <dbl> <dbl> <dbl>
1 ac        11  70.9   64    20.2     408.  6.09     84.5     57.3 13.6   84.5
2 iso       12  50     50.5  11.4     130.  3.29     57.2     42.8  7.24  57.2
# ℹ 1 more variable: lower <dbl>
Play around with df to see how the z-multiplier changes when using the T-distribution to calculate the 95% confidence interval.
 contrast effect.size    SE df lower.CL upper.CL
 ac - iso        1.29 0.463 21    0.329     2.25

sigma used for effect sizes: 16.2
Confidence level used: 0.95
Note that we’ve chosen to show a standardized effect size, using the pooled variance from the analysis of variance - Residual MS = 262.44, and √262.44 = 16.2
Test variances
leveneTest(co2 ~ anesth, low)
Warning in leveneTest.default(y = y, group = group, ...): group coerced to
factor.
Levene's Test for Homogeneity of Variance (center = median)
      Df F value Pr(>F)
group  1   2.604 0.1215
      21
t-test for equal variances
t.test(co2~anesth,var.equal=TRUE, data=low)
    Two Sample t-test

data:  co2 by anesth
t = 3.0927, df = 21, p-value = 0.005515
alternative hypothesis: true difference in means between group ac and group iso is not equal to 0
95 percent confidence interval:
  6.849172 34.969010
sample estimates:
 mean in group ac mean in group iso
         70.90909          50.00000
t-test for separate variances
t.test(co2~anesth,data=low)
    Welch Two Sample t-test

data:  co2 by anesth
t = 3.0206, df = 15.485, p-value = 0.008362
alternative hypothesis: true difference in means between group ac and group iso is not equal to 0
95 percent confidence interval:
  6.194866 35.623316
sample estimates:
 mean in group ac mean in group iso
         70.90909          50.00000
Wilcoxon-Mann-Whitney
wilcox.test(co2~anesth,data=low)
Warning in wilcox.test.default(x = DATA[[1L]], y = DATA[[2L]], ...): cannot
compute exact p-value with ties
    Wilcoxon rank sum test with continuity correction

data:  co2 by anesth
W = 114, p-value = 0.003398
alternative hypothesis: true location shift is not equal to 0